
MVRV Ratio i
— —
As of —
Source: Glassnode
Institutional frameworks. Historical truth.
Real value over time.
Explore leading on-chain and network valuation models alongside purchasing power analysis and comparative asset benchmarks. Built for long-term perspective, transparency, and education.
As of —
Source: Glassnode
As of —
Source: Glassnode
As of —
Source: Glassnode
As of —
Source: Glassnode
As of —
Source: Coin Metrics
Educational Framework: Historical data is for informational purposes only.
Past performance is not indicative of future results.
Data from institutional-grade providers
including Glassnode and Coin Metrics.
Clear definitions and replicable
methodologies for every model.
Focus on multi-year cycles and
structural trends, not short-term noise.
All content is for educational and
informational purposes only.
| Asset / Currency | Since 1971 | Since 2000 | Since 2010 |
|---|---|---|---|
| US Dollar Purchasing Power | — — | — — | — — |
| Gold (USD) | — — | — — | — — |
| Bitcoin (USD) | — — | — — | — — |
Source: BLS, FRED, World Bank, Coin Metrics
| Asset | 10Y | vs. Gold | vs. S&P 500 | vs. Real Estate | vs. M2 Money |
|---|---|---|---|---|---|
| Bitcoin | — — | — — | — — | — — | — — |
| Gold | — — | — — | — — | — — | — — |
| S&P 500 | — — | — — | — — | — — | — — |
| Real Estate | — — | — — | — — | — — | — — |
| M2 Money Supply | — — | — — | — — | — — | — — |
Source: Coin Metrics, FRED, S&P Dow Jones, NCREIF
Explore all calculators on the Calculators page.
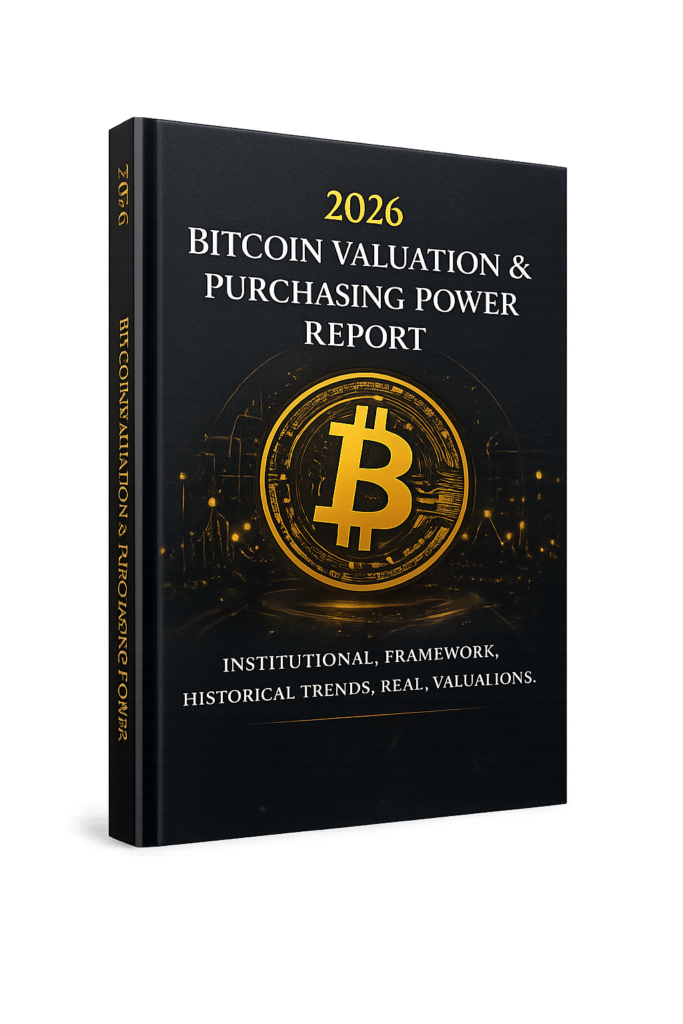
No Hidden Fees
Verified Sources
Not Investment Advice
Delivered to Your Inbox
We use institution-grade data and proven methodologies to analyze Bitcoin’s network and market metrics.
Models are interpreted within historical context and macroeconomic conditions.
All content is for educational and informational purposes only and should not be considered investment advice.
Bitcoin and other digital assets are volatile and may experience substantial price changes. Historical data, valuation models and comparative benchmarks do not guarantee future performance.
Users should conduct independent research and consult qualified financial, tax or legal professionals before making financial decisions.
This content is for informational and educational purposes only and does not constitute financial advice. Bitcoin investments carry risk and may not be suitable for all investors. Past performance is not indicative of future results.