frame 178

Comparative Asset
Benchmarks

Benchmarking Bitcoin’s purchasing power performance versus major store-of-value and macro assets.

Comparative analysis across multiple asset classes provides context for understanding relative performance of purchasing power preservation across different economic environments.

1. Purchasing Power Performance (Base Period Indexed) i

100K 10K 1K 100 2012 2013 2014 2015 2016 2017 2018 2019 2020 2021 2022 2023 2024 2025 Bitcoin Gold S&P 500 Global Real Estate M2 Money Supply US Dollar Purchasing Power

2. Asset Performance Summary (2012–May 15, 2025) i

Asset Total Change
(Indexed)
Volatility
(Annualized)
Inflation Protection
(Context)
Educational Notes
Bitcoin
21,450% 79.2% Very Strong Highest long-term purchasing-power growth, with high volatility.
Gold
654% 15.1% Strong Historically reliable store of value.
S&P 500
315% 16.3% Moderate Growth asset; returns include earnings and reinvested dividends.
Global Real
Estate
145% 8.8% Moderate Income-producing; illiquid, with location and interest-rate limitations.
$ M2 Money
Supply
95% 2.6% Low Measures liquidity expansion, not asset appreciation.
$ US Dollar
(Purchasing Power)
-69% None Dollar purchasing power has declined over the period.

3. Benchmark Method

Inflation-Adjusted & Nominal Context

All assets shown in purchasing power (real) terms using CPI (All Items, USD) unless otherwise noted.

Base-Period Normalization

Each asset is indexed to 100 at the base period (Jan 1, 2012) to compare relative purchasing power changes.

Source Transparency

Only reputable, publicly available sources are used. Data is historical and may be revised over time.

This framework is designed for educational research and long-term context. Not intended for short-term trading or investment decisions.

4.1 Bitcoin vs Gold i

Indexed (Base = 100)

Bitcoin / Gold Ratio
10 1 0.1 2012 2014 2020 2025
32.8x
Bitcoin / Gold Ratio
(As of May 15, 2025)

Bitcoin has outperformed gold significantly over the long term, with higher volatility.
4.2 Bitcoin vs S&P 500 i

Indexed (Base = 100)

Bitcoin / S&P 500 Ratio
100 10 1 2012 2016 2020 2025
68.1x
Bitcoin / S&P 500 Ratio
(As of May 15, 2025)

Bitcoin’s purchasing power growth has outpaced equities over the past decade.

4.3 Bitcoin vs Real Estate i

Indexed (Base = 100)

Bitcoin / Global Real Estate Ratio
100 10 1 2012 2016 2020 2025
148.2x
Bitcoin / Real Estate Ratio
(As of May 15, 2025)

Real estate shows steady appreciation, but Bitcoin’s long-term growth is far greater.

4.4 Bitcoin vs M2 Expansion i

Indexed (Base = 100)

Bitcoin / M2 Ratio
100 10 1 2012 2016 2020 2025
226.3x
Bitcoin / M2 Ratio
(As of May 15, 2025)

Bitcoin has grown much faster than global liquidity expansion measured by M2 money supply.

4.5 Purchasing Power Context i

Purchasing Power (Base = 100)

US Dollar Purchasing Power
100 50 0 2012 2016 2020 2025
-69%
Decline in USD Purchasing Power
(2012–May 15, 2025)

The US dollar has lost significant purchasing power over the past 13+ years.

5. How to Read These Benchmarks

Time Horizon Matters Long-term data smooths cycles and reveals structural trends.
Volatility vs. Preservation Higher volatility may accompany higher long-term returns.
Nominal vs. Real Returns We focus on purchasing power, not just nominal gains.
No Predictions This analysis is historical and not a forecast of future performance.
Educational Use Only For research, learning, and context—not investment advice.

6. Data Sources & Coverage

Coin Metrics

Bitcoin market data, prices, and network metrics.

FRED

Gold, CPI, M2 money supply, and economic data.

S&P Dow Jones
Indices

S&P 500 total return index in USD.

BIS / World Bank

Global real estate indices and macro data.

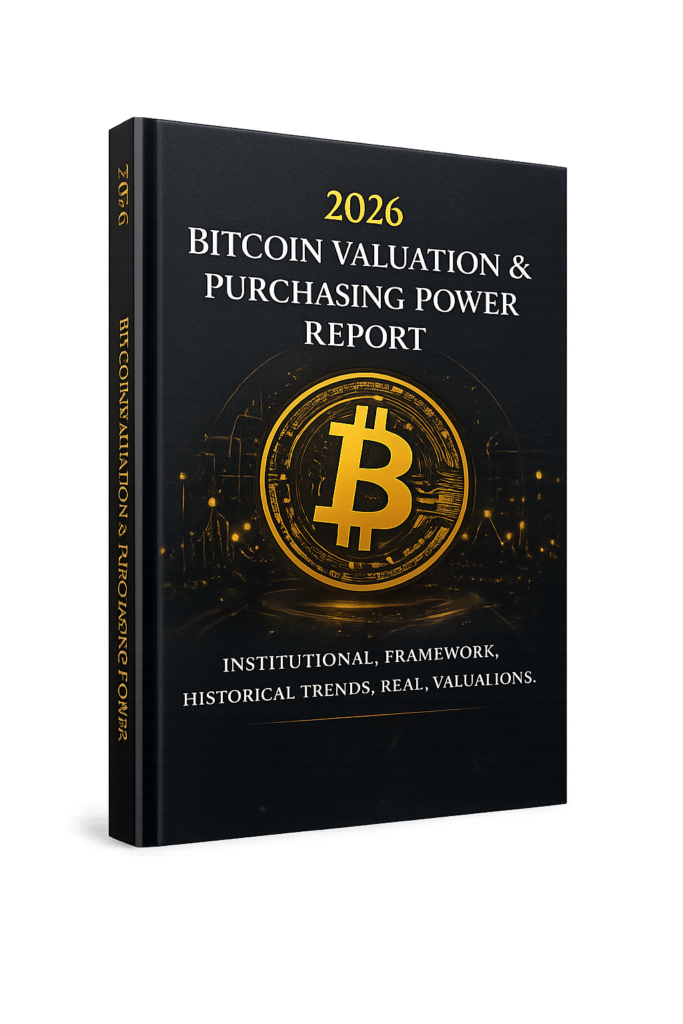
8. 2026 Bitcoin Valuation & Purchasing Power Report

2026 Bitcoin Valuation and Purchasing Power Report

Detailed insights, historical data, and institutional frameworks for navigating Bitcoin's role in a changing economy.

Institutional valuation models
Purchasing power & inflation analysis
Comparative asset benchmarks
Historical framework & methodology
Get the Free Report

We respect your privacy. Unsubscribe at any time.

9. Methodology & Risk

Historical examples only. Past performance is not indicative of future results.
Data subject to revision. Source data may be updated or revised over time.
No investment advice. For educational purposes only. Not a recommendation to buy, sell, or hold any asset.

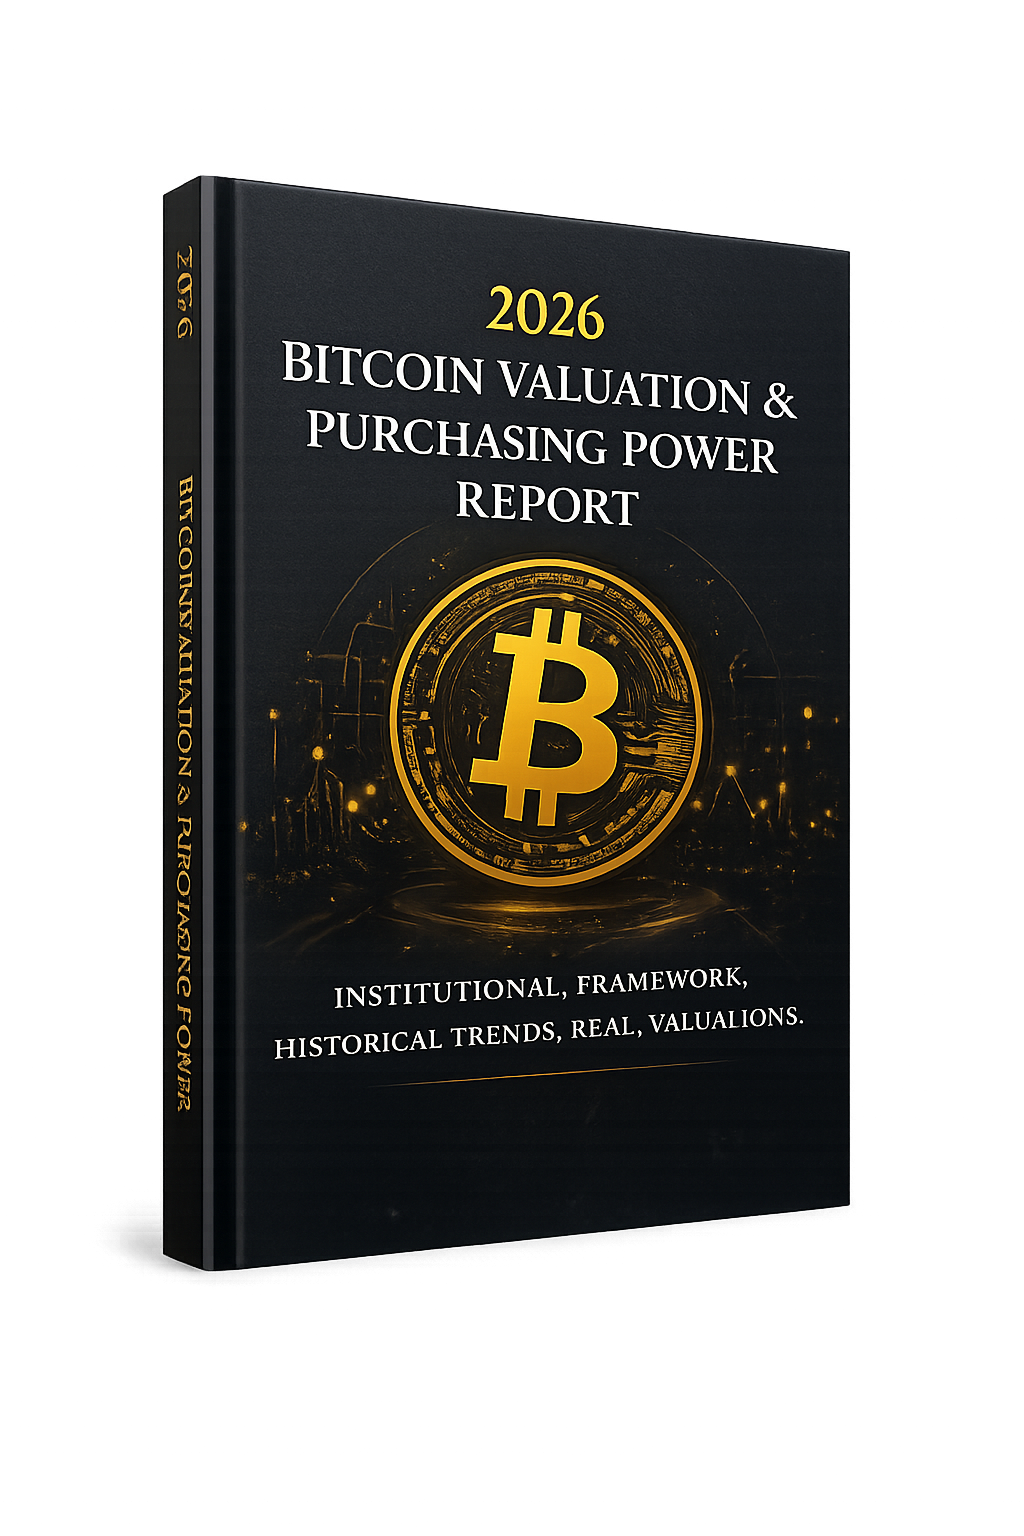
2026 Bitcoin Valuation &
Purchasing Power Report

chatgpt image aug 6, 2026, 04 10 36 pm
Institutional insights. Real data. Long-term perspective.

Featured Reviews & Best Picks

worth-bitcoin

100% Free

No Hidden Fees

Data-Driven

Verified Sources

Educational

Not Investment Advice

Instant Access

Delivered to Your Inbox